Over their K–12 experience, the average student will take more than 100 standardized tests. Yet almost all data on how students answer each question (i.e., item-level data) are discarded in favor of a single aggregate score. This summary score shapes major decisions in education, including student promotion, teacher evaluation, and policy.
In this study, the researchers ask, Does collapsing test data into one number throw away valuable information? Using eight years of administrative data from 5 million students in Texas public schools, this research team analyzed whether item-level data are more predictive of adult mobility outcomes and teacher effectiveness than summary scores.
Using machine learning methods, they found that aggregation discards important information. Item-level data were more predictive of student outcomes (e.g., disciplinary action, high school graduation, and wages) than aggregate scores.
Key Takeaways
The assumption embedded in most education standardized test design (i.e., that there is no extra information in item-level data) is oversimplified. Summary scores mask how student and teacher performance varies across topics. The researchers compared rankings of performance overall with rankings based on individual item performance: If a single aggregate score captured all the information in the test, then the rank orderings by overall performance would have been the same as the rank ordering based on individual items. Instead, the researchers found that teachers’ value-added rankings (i.e., effectiveness at improving their students’ scores) lined up only about 66 percent of the time, and students’ aligned about 75 percent of the time, underscoring how individual strengths can differ across subjects.
The researchers estimate that aggregation discards 9 to 20 percent of the information (i.e., systematic, nonnoise variation) a test gathers about student performance in a given grade and year.
Using value-added methods, the authors estimate that 58 to 74 percent of the information about teacher performance rankings is discarded with aggregation.
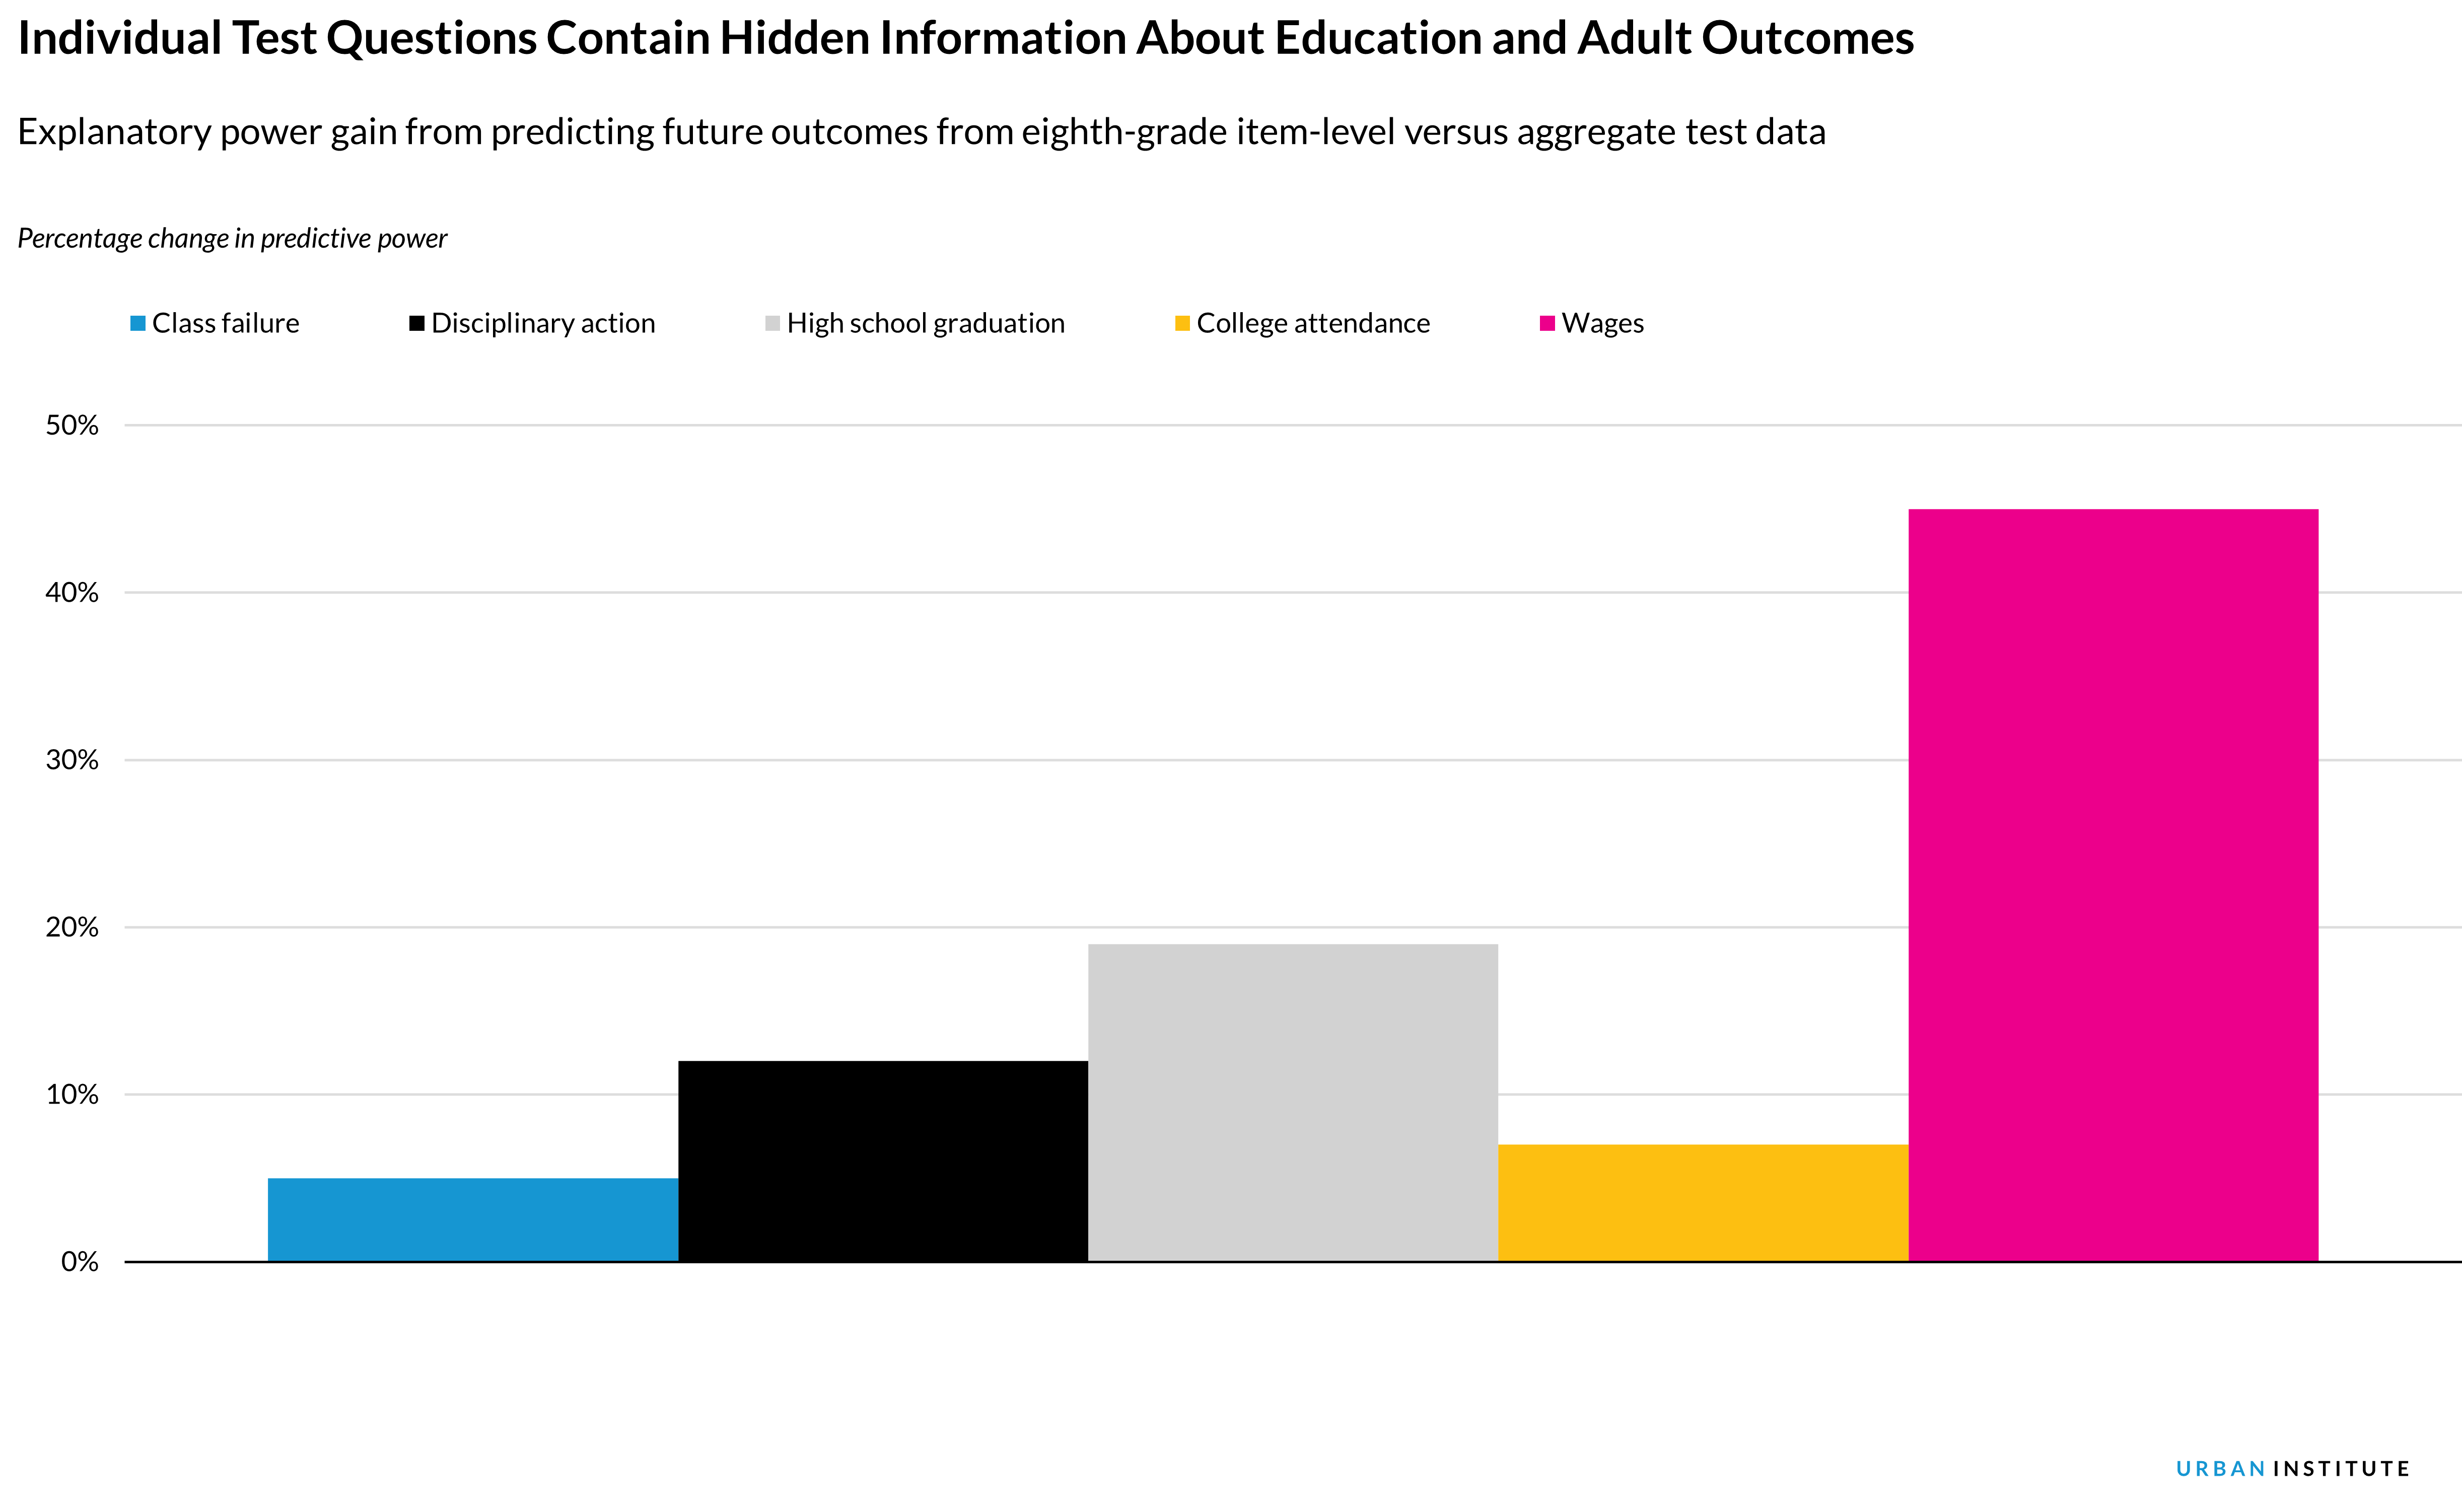
Using machine learning methods, the researchers designed alternative aggregators for specific mobility outcome prediction and found that item-level scores compiled in this way were more predictive of class failure (a 5 percent increase in accuracy), disciplinary action (12 percent), high school graduation (19 percent), college attendance (7 percent), and wages (45 percent) than aggregate test scores. Similarly, item-level data better predicted teachers’ value-added than overall test scores alone.
Source: Research team’s analysis (PDF)
Simplistic summary scores could also lead to flawed classifications of students and teachers. When trying to identify the bottom 5 percent of performers in terms of student or teacher outcomes, the researchers found summary measures are correct less than half the time.
No single score is most predictive of students’ later success. Different items matter for different outcomes (discipline versus graduation versus college enrollment). Aggregate scores force a false assumption that one score can robustly forecast an array of future outcomes, sidestepping deeper questions about what education should prioritize.
The researchers ran a proof-of-concept policy simulation, demonstrating that it is possible to group test items that are most relevant for predicting the outcome of interest (e.g., course grades, disciplinary action, high school graduation, college graduation, and adult wages) from one assessment year to the next because of underlying similarity in test design. Future work can extend this exploration, including the skills that map to question performance patterns.
Looking ahead, the researchers are optimistic that, with additional work, leveraging more of the data schools collect may not be exceedingly costly. Because the underlying test data are already collected, the primary costs associated with using an item-level approach, compared with an aggregate approach, would be data analysts’ time and computing resources.
Potential Implications for Policymakers and Practitioners
Additional validation and translational work are needed to bolster these findings and enable their uptake into policy and practice settings, but SUMI sees the following potential applications:
Strengthen and expand existing aggregate scores to improve forecasting of key education outcomes. Assessment designers working in partnership with school and state education leaders could develop additional aggregate scores designed to predict key outcomes.
Harness item-level data to target supports and improve instruction. Policymakers and school administrators could, via these newly designed aggregate scores, use rich, item-level data to better identify which students are on track for different outcomes, to identify which students may need additional supports, and to determine how to support teachers.
Leverage college and career readiness and skills-based movements to modernize measurement. Leaders of high school redesign, college and career readiness, and skills-based education movements could be early adopters of item-based measurement innovations. Their focus on how we define and measure success in schools may make them natural champions for this work.
Future Research Directions
Future research could explore the following:
- optimizing how items are categorized to make item-based prediction more practical, as test items change from year to year
- how to fold these insights into test design (e.g., build questions that more adequately predict long-run outcomes of interest)
- how to incorporate these insights into real-world feedback and accountability systems
- extension analyses in other states
- searching for the patterns in item-level data that elucidate the skills that promote different outcomes
Methods, Data Sources, and Measures
This research team analyzed administrative data from the Texas Education Agency on public school students enrolled from the 2011–12 to the 2018–19 school years. They focused on math and reading score data that included item-level responses. They also used value-added methods that used links between students and their teachers to assess teachers’ ability to help their students improve their test scores.
The research team then linked the item-level data with students’ outcomes through 2021, as captured in the Texas Education Agency, the National Student Clearinghouse, and state unemployment insurance system records. Using machine learning, they explored how item-level responses correlated with student outcomes such as classroom academic performance (e.g., class failure), disciplinary infractions, high school graduation, college attendance, and earnings data up to five years after high school graduation for workers in jobs covered by unemployment insurance.
Research Team
Jesse Bruhn
Principal Investigator, Brown University
Michael Gilraine
Simon Fraser University
Jens Ludwig
University of Chicago
Sendhil Mullainathan
Massachusetts Institute of Technology
Emerging Insights
Skills that drive student upward mobility
Measuring skills that drive student upward mobility
External resources
Do Test Scores Misrepresent Test Results? An Item-by-Item Analysis (EdWorkingPaper)
Do Test Scores Misrepresent Test Results? An Item-by-Item Analysis (NBER working paper)